Build a daily scorecard that connects traffic, checkout, customer acquisition and fulfillment to the money your orders actually leave behind.
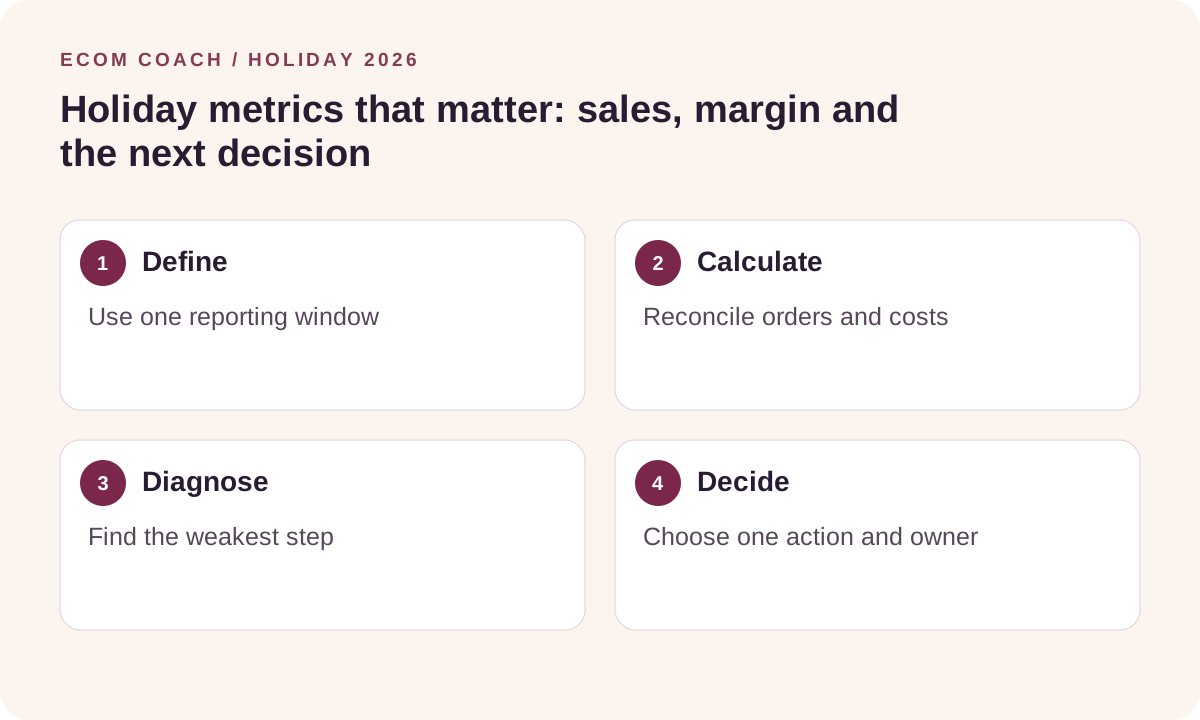
Holiday 2026 field guide. Start with the holiday growth center. Black Friday: November 27. Cyber Monday: November 30. Examples below are planning scenarios, not client results.
Choose a business goal before choosing a dashboard
A bigger sales number can hide smaller contribution, more returns and an exhausted team. Define a holiday win using three measures: contribution after acquisition, orders fulfilled within your promise, and customers who come back after the season. Set a cash ceiling too: inventory and advertising may need paying before customer payouts settle.
Use your own recent comparable days and last holiday season where available. Compare the same weekday, elapsed hours, currency, channel, geography and device. A store selling custom furniture should not borrow the conversion target of a low-priced beauty brand.
The compact scorecard
| Metric | Definition for this plan | What to do with it |
|---|---|---|
| Net merchandise sales | Product sales − discounts − merchandise refunds; exclude tax and shipping collected. | Reconcile to orders; separately label estimated future refunds. |
| Order conversion | Completed online orders ÷ online sessions × 100. | Use the same channel/window; inspect mobile and new/returning traffic separately. |
| Net AOV | Net merchandise sales ÷ completed orders. | Read alongside contribution per order and units per order. |
| Checkout completion | Completed checkouts ÷ initiated checkouts × 100, using compatible funnel events. | Test payment, delivery charges, codes and errors when it falls. |
| Blended acquisition cost per order | Total selected acquisition spend ÷ all completed orders. | This is not new-customer CAC and not a channel-specific CPA. |
| Paid-media MER | Net merchandise sales ÷ paid-media spend. | Do not add platform-attributed revenues together; attribution overlaps. |
| Contribution after acquisition | Net merchandise sales − landed product costs − fulfillment/packaging − net shipping cost − fees/other variable costs − acquisition spend. | This is before fixed overhead and income tax; it is not net profit. |
| Return and fulfillment signals | Returned orders ÷ orders in the same matured cohort; overdue unfulfilled orders; cancellations. | Review cohorts after returns have had time to arrive. Today’s refunds may belong to older sales. |
Step 1: agree on the numbers
Write down the source for every metric. Use the commerce system for orders, net sales and refunds; analytics for consented sessions and funnel events; ad platforms for spend; and finance/operations for costs. Tracking loss and different time zones can create apparent disagreements. Mark missing data as unknown rather than zero. AOV definitions vary between platforms; this guide uses the definition above.
Step 2: work one example all the way through
Illustrative day: 5,000 sessions produce 100 orders and $8,000 net merchandise sales. Product costs are $3,200, fulfillment $400, net shipping $350, payment fees $240, other variable costs $110 and acquisition $2,000. Conversion is 2%; AOV is $80; contribution before acquisition is $3,700, or $37 per order. After acquisition, contribution is $1,700, or $17 per order. The $37 is the break-even acquisition allowance before fixed overhead, not permission to spend it all.
If all $2,000 is paid-media spend, MER is 4.0×. This still says nothing about incrementality. If some spend is creator commissions, record paid-media spend separately. If fees are already included elsewhere, do not subtract them twice. Use the daily scorecard to check the arithmetic.
Step 3: turn a change into a diagnosis
- Traffic rises, conversion falls: inspect traffic quality and mobile product-page clarity before scaling spend.
- AOV rises, contribution falls: inspect bundle discounts, free shipping, commissions and expensive fulfillment.
- Checkout starts rise, orders stall: test payment methods, delivery options, stock and discount combinations.
- Sales look strong, cash feels tight: review payout timing, inventory invoices, refunds and advertising bills.
Step 4: run a short review
Before the promotion, check once each working day. During peak days, agree on two or three review times and one on-call owner. Record the observation, likely explanation, action, owner and next check. At low volume, inspect errors and customer questions first; one order can make a percentage swing look dramatic. Do not declare an A/B-test winner from a handful of purchases.
For channel experiments, predefine the budget cap, success measure and acceptable downside using your contribution economics. Reconcile again in December and January when returns mature. That is how a holiday review becomes useful for next year.
Download the free holiday action workbook or calculate your daily scorecard.
Need a definition beyond this scorecard? Keep our 72-term ecommerce glossary nearby for LTV, CAC, ROAS, retention, inventory and store technology.
Ecommerce Growth Coaching · $750 / month
Two working sessions per month on one growth priority, with written next steps and one agreed artifact review.
Start with a free fit conversation. A written scope and payment instructions come before paid work begins.