Know what the numbers mean, ask better questions and make decisions with more confidence. Keep this guide beside your store dashboard.
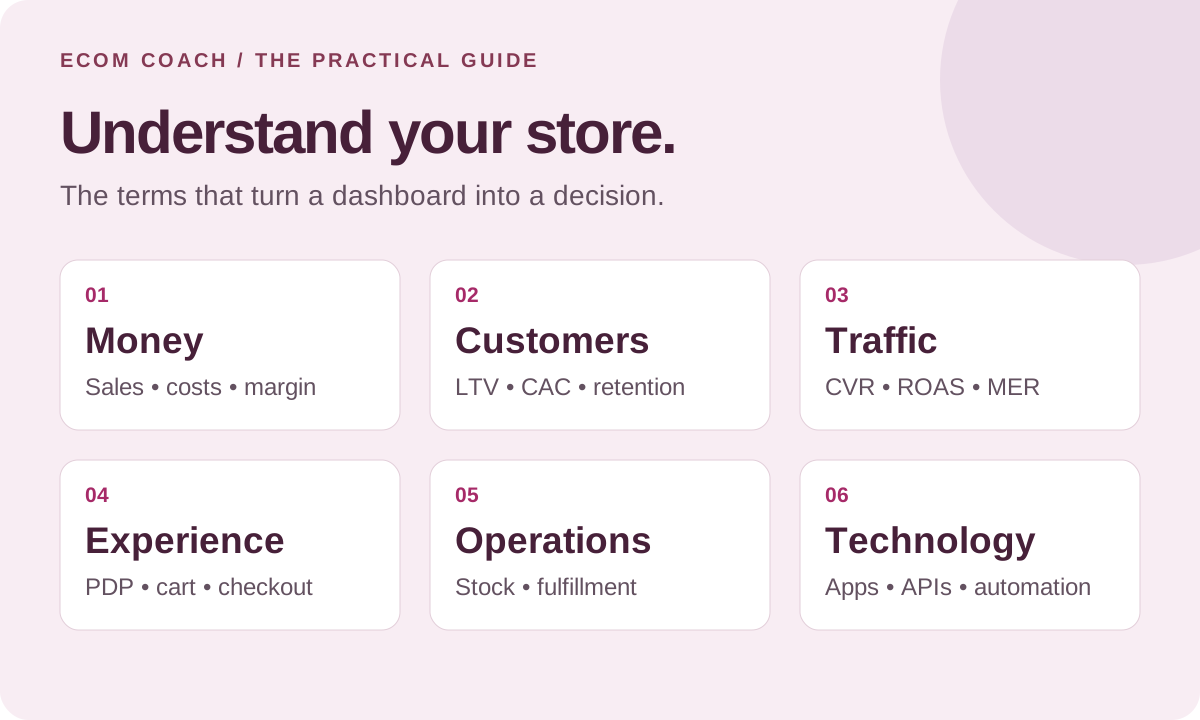
We went through the pain of this so you don’t have to. Ecommerce comes with enough acronyms to make a simple business question feel like an exam. This is your translation guide: what each term means, why it matters and where it can lead you astray.
You do not need to memorize everything. Start with net sales, conversion, AOV, contribution, CAC and repeat purchasing. Use the rest when the decision calls for it.
72 essential terms. Every entry includes a practical example. Use your browser’s Find command to jump to an acronym. These are working definitions, not a universal reporting standard. Keep the same dates, currency, channel, customer cohort and treatment of refunds when comparing results.
Sales, costs and profit
Gross sales
The merchandise value before discounts and sales reversals. It is the starting line, not the amount you keep. Check whether your report includes canceled or unpaid orders.
Example You sell 20 candles listed at $30 each. Gross merchandise sales are 20 × $30 = $600, before any coupons or refunds.
Net merchandise sales
Gross merchandise sales minus discounts and sales reversals such as refunds or returns. For the examples here, exclude tax and shipping collected. Reconcile order edits and exchanges rather than treating every reversal as a physical return.
Example From $600 gross sales, subtract $60 in discounts and $30 in merchandise refunds: $510 net merchandise sales. Keep shipping collected and sales tax outside this example.
AOV — average order value
Sales value ÷ orders. Label the sales basis: our scorecard uses net merchandise sales, while some platforms use order-time sales before later adjustments. $8,000 ÷ 100 orders = $80. Bigger AOV only helps when the extra basket leaves useful margin.
Example A store records $2,400 net merchandise sales across 30 completed orders. Net AOV is $80. If next week AOV rises to $90, check whether contribution per order improved too.
UPT — units per transaction
Units sold ÷ orders in the same period. Decide whether returned units are removed. If 100 orders contain 240 units, UPT is 2.4. Use this to understand bundles and multi-item baskets.
Example A gift shop sells 90 units across 50 orders. UPT is 1.8. After offering a relevant two-item set, compare units per order and contribution using the same returns treatment.
COGS — cost of goods sold
The product cost associated with the goods sold. Use a consistent cost method and returns treatment. Buying $10,000 of stock does not automatically mean you incurred $10,000 of COGS this month.
Example You sell 30 mugs with a $12 unit product cost. COGS for those mugs is $360. Unsold mugs remain inventory under this simplified example.
Landed cost
The cost to get a product into sellable inventory: purchase or manufacturing cost plus allocated inbound freight, duties and other applicable costs. Separate inbound costs from the shipping charge to deliver an order to your customer.
Example A supplier charges $15 per item. Allocated inbound freight adds $2 and duties add $1, making landed cost $18 per item before customer delivery.
Gross profit and gross margin
Gross profit = net sales − COGS. Gross margin % = gross profit ÷ net sales × 100. A $100 sale with $40 COGS leaves $60 gross profit and 60% gross margin, before other expenses.
Example A bag sells for $100 net of discounts and has $50 COGS. Gross profit is $50; gross margin is $50 ÷ $100 = 50%. Shipping, payment fees and other costs still need to be covered.
Markup
The amount added to cost, expressed relative to cost: (selling price − cost) ÷ cost × 100. A product costing $50 and selling for $100 has 100% markup but 50% gross margin. The denominators are different.
Example That same $50-cost bag sells for $100. The $50 increase divided by the $50 cost gives 100% markup. A 100% markup does not mean a 100% gross margin.
Contribution margin
Sales minus a stated set of variable costs. For store decisions, include product, fulfillment, net shipping, transaction fees and other per-order costs. State whether acquisition spend is included. Contribution after acquisition still has to cover fixed overhead.
Example An order produces $100 net sales. Subtract $40 product cost, $10 other variable operating costs and $20 acquisition cost. It leaves $30 contribution after acquisition, before fixed overhead and tax.
Net profit
What remains after all applicable expenses, including overhead, financing costs and taxes. A positive contribution margin is not proof that the whole business is profitable.
Example Across a simplified month, $4,000 contribution after acquisition minus $2,500 fixed overhead, $200 interest and $300 income tax leaves $1,000 net profit.
Cash flow
The timing and amount of money entering and leaving the business. Inventory payments, payout delays and refunds can create a cash shortage even when sales look healthy. Forecast the dates, not just the totals.
Example You have $5,000 in the bank and pay a $4,000 supplier invoice today. A $2,000 customer payout arrives next week. Until it arrives, you have $1,000 available, even if your dashboard shows strong sales.
Break-even and allowable acquisition cost
Break-even is where the specified revenue covers the specified costs. Contribution before acquisition is an upper limit on acquisition spend before overhead and profit. Your practical target should also leave room for those obligations and uncertainty.
Example A product leaves $35 contribution before acquisition. Spending $35 to acquire that order leaves nothing for overhead or profit. Reserving $10 for those needs would imply a $25 acquisition target in this simplified plan.
Where does a $100 order go?
Start with net merchandise sales. Allocate each cost once.
- $40 product costCOGS for the order
- $10 operating costsFulfillment, net shipping and fees
- $20 acquisitionAllocated once
- $30 contributionAfter acquisition
$100 − $40 − $10 − $20 = $30. That $30 still has to cover fixed overhead, financing costs, taxes and profit. It is not net profit.
Same product. Two different percentages.
A $100 selling price and $50 product cost leave $50 gross profit.
$50 gross profit ÷ $100 selling price
$50 increase ÷ $50 product cost
Gross margin compares profit with the selling price. Markup compares the increase with the cost. Both answers are correct for this product.
Definition check: Shopify’s sales report reference distinguishes order-time AOV from net sales after reversals. Our daily scorecard explicitly uses net AOV, so the two may differ.
Customers, LTV and retention
LTV / CLV / CLTV — customer lifetime value
The cumulative value of a customer relationship. Always specify revenue versus contribution, observed versus predicted, and the time horizon. Revenue LTV can look impressive while the same customer produces little contribution. See the worked example below.
Example A customer places four $75 net orders. Observed revenue value to date is $300. If variable operating costs total $180, observed contribution before acquisition is $120. Future purchases are still unknown.
CAC — customer acquisition cost
Acquisition costs ÷ new customers acquired. Define which marketing, sales, creative, agency and labor costs you include. Match the cost window to the acquisition period; long buying cycles complicate the calculation. CAC is about new customers, not every order.
Example You include $3,000 ad spend, $600 creative and $400 acquisition labor in your cost definition. With 80 new customers in the matching period, CAC is $4,000 ÷ 80 = $50.
Blended acquisition cost per order
Total selected acquisition spend ÷ all completed orders. It includes orders from returning customers in the denominator. $5,000 ÷ 150 orders = $33.33; if only 100 customers were new, CAC on that same cost basis is $50.
Example The same $4,000 acquisition budget supports 125 total orders, including returning buyers. Blended acquisition cost per order is $32. CAC remains $50 if there are 80 new customers.
LTV:CAC ratio
Selected customer lifetime value ÷ CAC. Label the LTV basis. A revenue-based ratio and a contribution-based ratio cannot be compared as if they mean the same thing. There is no universal ratio that makes every store safe to scale.
Example Estimated contribution LTV of $180 divided by $60 CAC gives 3×. If the $180 was revenue instead of contribution, the ratio would describe a different—and less useful for spending—relationship.
CAC payback period
How long it takes cumulative customer contribution, before acquisition cost, to recover CAC. A customer who repays acquisition in six months still needs funding during those months. Estimate from cohort purchases, not an assumed monthly subscription formula.
Example Acquiring a customer costs $60. Their first order leaves $32 contribution before acquisition; their second, 45 days later, adds another $32. Cumulative contribution reaches $64, recovering CAC at day 45 in this example.
Cohort
A group with a shared starting point, such as customers whose first order was in November. Compare each group at the same age: 30, 90 or 180 days after first purchase. Otherwise older customers have had more time to buy.
Example Compare customers first acquired in January with those first acquired in February at 90 days after each person’s first order. Comparing both groups’ totals on March 1 would give January buyers more time to purchase again.
Repeat purchase rate
A defined share of customers who purchase again. For a 90-day cohort measure: customers with a second order within 90 days ÷ all first-time customers in that cohort. Wait until everyone has had the full observation window.
Example Of 100 new customers with a full 90 days of follow-up, 24 place a second order within that window. The cohort’s 90-day repeat purchase rate is 24%.
Purchase frequency
Orders ÷ purchasing customers during a stated period. If 200 customers place 500 orders in a year, frequency is 2.5 orders per purchasing customer. It is not automatically the future buying rate of a new customer.
Example During one year, 80 purchasing customers place 200 orders. Annual purchase frequency is 2.5. That does not mean every one of those customers placed two or three orders.
Retention and churn
Retention describes customers who stay active; churn describes those who leave under your definition. Subscription cancellations are observable. For a store without subscriptions, define an inactivity window; a customer who has not purchased this month has not necessarily left.
Example A subscription starts the month with 100 active customers. If eight of those cancel and none reactivate by month-end, that starting cohort retains 92% and loses 8%. Exclude newly added customers from this cohort calculation.
RFM — recency, frequency, monetary value
A way to group customers by how recently they bought, how often they buy and how much they spend. Use it to distinguish new buyers, valuable repeat buyers and customers who may need a relevant reintroduction.
Example Maya bought last week, has placed six orders and spent $600. Leo bought once nine months ago for $40. They may need different messages, even though both are on the customer list.
CRM — customer relationship management
The practices and software used to organize customer relationships, history and follow-up. A CRM record is not permission to send every type of marketing message. Keep communication preferences and consent connected to the record.
Example A high-ticket store records a buyer’s consultation, selected product, delivery question and agreed follow-up date in one customer record. A teammate can continue the conversation without asking the buyer to repeat everything.
MRR — monthly recurring revenue
Recurring subscription revenue normalized to one month. Exclude one-time purchases and state the treatment of discounts, tax and canceled plans. A store doing $20,000 in monthly sales does not have $20,000 MRR unless the revenue is recurring.
Example A subscription has 50 active customers paying $20 each month: $1,000 MRR before any stated adjustments. An additional $500 of one-time gift sales does not raise MRR to $1,500.
LTV: work through the dollars before you scale
A revenue estimate can be written as average order value × purchases per year × relationship length in years. That is a forecast when future purchases or lifespan are assumed. It is useful for scenarios, but it is not cash in the bank.
One customer, two very different “values”
Assume an $80 net AOV, three purchases per year and a two-year relationship. Estimated revenue LTV = $80 × 3 × 2 = $480.
If 40% of those sales remains after product and other variable operating costs, before acquisition, estimated contribution LTV = $480 × 40% = $192. This simplified example assumes a stable margin and purchase pattern and does not discount future cash flows.
At $60 CAC, revenue LTV:CAC is 8×. Contribution LTV:CAC is 3.2×. Estimated contribution after that acquisition cost is $132, still before fixed overhead and income tax. Those three numbers answer different questions.
When does this customer repay $60 CAC?
Each $80 order leaves $32 contribution before acquisition. Three orders arrive on days 0, 45 and 90.
Payback occurs at the second order, day 45, in this scenario. The bars show contribution before acquisition; the cards subtract CAC once. Fixed overhead and tax remain outside the example. No second order means no assumed recovery.
On the first $80 order, 40% contribution leaves $32 before acquisition. Paying $60 to win the customer leaves a $28 gap. Under these assumptions, cumulative contribution passes $60 on the second order. The time until that order—and whether it actually happens—determines payback.
What to do when your store is new
Do not invent a five-year customer lifespan from a few weeks of sales. Start with observed 30-, 90- or 180-day customer value. For a fully observed cohort, divide its cumulative net merchandise sales by the original number of acquired customers. Do the same with contribution before acquisition. Keep non-repeat buyers in that denominator. Call the result “90-day value,” not completed lifetime value.
For example, 100 newly acquired customers produce $12,000 net sales and $4,800 contribution before acquisition in their first 90 days. Observed 90-day revenue value is $120 per acquired customer; contribution value is $48. Compare that $48 with the cohort’s acquisition cost before deciding how much to spend next.
Compare cohorts at equal ages and examine discount use, returns, product mix and acquisition source. Update forecasts as evidence accumulates. You can model optimistic and conservative repeat-purchase scenarios without treating either one as a promise.
Further reading: Shopify’s introduction to historical and predicted customer lifetime value. The examples and contribution scenarios above are original illustrations.
Traffic, advertising and attribution
Session and user
A session is a group of interactions within an analytics-defined visit; a user is an analytics identifier for a visitor. One person can create several sessions or appear as multiple users across devices. Neither count is automatically a unique customer count.
Example One shopper visits in the morning and returns that evening. Your analytics may record one user and two sessions, depending on its identification and session rules. That is not two customers.
CVR — conversion rate
The share that completes a defined action. Order conversion = completed online orders ÷ online sessions × 100 in our scorecard. User conversion and sessions containing a purchase use different denominators. State which one you mean.
Example There are 100 completed online orders and 5,000 online sessions in the same window. Order conversion is 100 ÷ 5,000 × 100 = 2%. Use the same channel and order exclusions each time.
CTR — click-through rate
Clicks ÷ impressions × 100. Specify all clicks versus link clicks. For email, define unique clicks relative to delivered messages. A high CTR shows an effective invitation; it does not prove the resulting traffic buys.
Example An ad receives 10,000 impressions and 300 link clicks. Link CTR is 300 ÷ 10,000 × 100 = 3%. A separate “all clicks” metric might include reactions or other interactions.
CPC — cost per click
Ad spend ÷ ad clicks. $300 for 200 clicks is $1.50 CPC. Cheap clicks can be expensive customers if they are poorly matched to the product or the buying path fails.
Example You spend $240 for 160 ad clicks. CPC is $1.50. If only two clicks become orders, the ad-spend-only cost per order is $120.
CPM — cost per thousand impressions
Ad spend ÷ impressions × 1,000. It describes the cost of exposure. Compare it with audience, placement, reach, frequency and downstream results instead of treating a low CPM as the business goal.
Example An ad costs $200 and receives 40,000 impressions. CPM is $200 ÷ 40,000 × 1,000 = $5. That tells you the exposure cost, not how many people bought.
CPA — cost per action or acquisition
Spend ÷ the platform’s chosen conversion action. A CPA for a signup, order or first-time customer means something different in each case. Check the action definition and attribution window before comparing channels.
Example A campaign spends $600 and records 30 newsletter signups. Its signup CPA is $20. If it records six purchases, purchase CPA on the same spend is $100. Label the action.
ROAS — return on ad spend
Revenue attributed to ads ÷ ad spend. $4,000 attributed revenue on $1,000 spend is 4× ROAS. This is revenue efficiency, not profit or proof that all those sales were caused by the ads.
Example An ad platform credits $4,000 revenue to $1,000 spend: 4× ROAS. If product and other variable operating costs total $2,600, the attributed orders leave $400 after the ad spend, before overhead.
MER — marketing efficiency ratio
Usually total store revenue ÷ marketing or advertising spend, but conventions vary. Our holiday scorecard labels paid-media MER as net merchandise sales ÷ paid-media spend. State the numerator and denominator so weekly comparisons remain meaningful.
Example A store has $10,000 net merchandise sales and $2,000 paid-media spend. Paid-media MER is 5×. Including another $500 of acquisition costs produces 4× on an all-acquisition-spend basis; use a different label.
ROI — return on investment
Net gain attributable to an investment ÷ investment cost × 100. Define the full cost and time horizon. Do not use revenue in the numerator and call the result profit-based ROI.
Example A $500 improvement produces $800 of incremental contribution before that improvement’s cost. Net gain is $300, so ROI is $300 ÷ $500 = 60%, assuming the measured lift was caused by the improvement.
Attribution and attribution window
Attribution assigns credit to touchpoints under a model; the window limits how long after an interaction a conversion can receive credit. Two platforms may both claim one order. Do not add their attributed revenue together as total store sales.
Example A buyer clicks an ad, later clicks an email and places one $100 order. Both platforms may claim it under their attribution settings. Your store still has one $100 order, not $200 of sales.
Incrementality
The additional outcome caused by an activity compared with what would have happened without it. A well-designed holdout can help estimate it. An app claiming credit for an order does not by itself prove that the order was additional.
Example In an illustrative randomized test, 1,000 people receiving an offer place 80 orders; a comparable 1,000-person holdout places 60. The observed difference is 20 orders. Check statistical uncertainty and costs before claiming a reliable lift.
UTM parameters
Labels added to links to describe source, medium, campaign and related details in analytics. Use a consistent naming plan. Keep customer names, email addresses and other personal information out of URLs.
Example A gift-guide link uses utm_source=newsletter, utm_medium=email and utm_campaign=holiday_gifts. Those labels help group visits from that campaign without putting a customer’s email address in the URL.
SEO and product feeds
SEO helps search engines understand and surface useful pages. A product feed supplies structured catalog data to shopping channels. Clear titles, identifiers, price, availability and landing-page consistency matter for feeds; neither approach guarantees visibility.
Example A “gifts for new gardeners” collection answers a clear search need. Its product feed also sends each item’s identifier, price and stock status to the shopping channel. Good page content and accurate feed data solve different discovery jobs.
CRO — conversion rate optimization
A process of finding and testing ways to improve a buying journey. Research, error fixes and clearer information count. Track contribution and customer experience alongside conversion so a lift does not simply come from excessive discounts.
Example Customers cannot find the delivery estimate. Move clear delivery information beside the buy button, then monitor checkout completion, support questions and contribution. Treat any observed improvement as evidence to investigate, not automatic proof of causation.
Four stages. Three useful rates.
A simplified journey with nested sessions: each session contributes at most one cart, checkout and order. Bars share a 5,000-session scale.
100 ÷ 5,000
(400 − 100) ÷ 400
100 ÷ 200
The denominator changes the question. These nested counts are for teaching; real funnels need compatible events, matching windows and a clear treatment of sessions that skip or repeat stages.
The storefront and customer journey
PDP — product detail page
The page that helps someone decide about a specific product. Explain who it suits, variants, price, proof, delivery and returns. A great PDP answers the questions that would otherwise stop checkout.
Example For a backpack, the PDP shows capacity, dimensions, laptop fit, material, photographs, delivery timing and returns. A shopper can decide whether it fits a 16-inch laptop before ordering.
PLP — product listing page
A collection or category page that helps people compare and narrow options. Useful filters, sorting, availability and clear product cards reduce the work of finding the right item.
Example A shoe collection lets shoppers filter by size, use and price, then see available colors. The goal is to find suitable options before opening individual product pages.
CTA — call to action
A clear next step such as “Choose a size,” “Add to cart” or “Book a demo.” Match it to what the customer can actually do next. Competing primary actions can make that decision harder.
Example A configurable chair needs a fabric selection first, so “Choose your fabric” is a clearer next step than a button that promises an immediate purchase but opens a configuration screen.
Cart versus checkout abandonment
Cart abandonment concerns shoppers who add items and do not purchase; checkout abandonment concerns those who start checkout and do not finish. Define the event window and user/session basis. The two rates are not interchangeable.
Example In a simplified nested journey, 400 sessions add a cart, 200 reach checkout and 100 purchase. Cart abandonment is (400 − 100) ÷ 400 = 75%; checkout abandonment is (200 − 100) ÷ 200 = 50%.
Checkout completion rate
Completed checkouts ÷ initiated checkouts × 100, using compatible events and a consistent window. A decline is a reason to inspect payment errors, surprise charges, delivery limits and broken discount codes.
Example Of 200 sessions starting checkout, 100 complete it. Checkout completion is 50%. Use compatible events and follow-up windows so late purchases are not incorrectly treated as failures.
Upsell
An optional move to a higher-value version of the item being considered, such as a larger capacity or premium edition. Explain the added benefit clearly and preserve the customer’s original choice.
Example A buyer chooses a $60 kettle. You show an optional $85 temperature-controlled version and explain the useful difference. They can still buy the original kettle without dismissing repeated offers.
Cross-sell and bundle
A cross-sell suggests a complementary product. A bundle sells a group together. Check combined product cost, fulfillment, discount stacking and component inventory before assuming that a bigger basket leaves more money.
Example For the kettle, a tea infuser is a cross-sell. A kettle, infuser and tea sold together is a bundle. Check combined costs and component inventory before setting the bundle price.
UGC — user-generated content
Photos, videos or other material created by customers or creators. Secure permission to reuse it and disclose paid relationships where applicable. A paid creator demonstration should not be presented as an independent customer review.
Example With permission, a customer’s photo shows how a lamp looks in a small living room. A creator paid to demonstrate that lamp can provide useful content too, but the commercial relationship should be disclosed appropriately.
A/B test
A comparison that randomly assigns eligible traffic to different versions. Choose a primary outcome and guardrails in advance. A few purchases or a before/after comparison during different promotions is not strong evidence of a winner.
Example Randomly assign eligible visitors to the current product page or a version with clearer size guidance. Predefine purchase completion as the primary outcome and returns as a guardrail; do not stop simply because one version gets an early sale.
Bounce rate and engagement rate
In GA4, bounce rate is the share of sessions that are not engaged; engagement rate is the complementary share. It does not simply mean “viewed one page.” Definitions differ from older analytics tools.
Example GA4 records 600 engaged sessions out of 1,000 sessions. Engagement rate is 60%; bounce rate is 40%. A single-page visit can still be engaged under GA4’s rules.
Campaign, flow and segment
A campaign is a planned message to an audience. A flow is a triggered sequence such as post-purchase guidance. A segment is a group defined by rules. Check eligibility, consent, suppression and exits before activating an automated flow.
Example A one-time Black Friday announcement is a campaign. A care guide triggered three days after purchase is a flow. “Bought skincare in the last 90 days” is a segment. Each still needs appropriate message eligibility.
Deliverability and CTOR
Deliverability concerns reaching the inbox, beyond merely being accepted by a mail server. CTOR means click-to-open rate, commonly unique clickers ÷ unique openers. Privacy features and automated clicks can distort email engagement; use downstream outcomes too.
Example A report shows 1,000 delivered emails, 400 unique openers and 40 unique clickers. Reported CTOR is 10%; clicks per delivered email are 4%. Neither figure alone proves inbox placement or reliable human engagement.
Analytics references: GA4 engagement and bounce rate and event-level versus item-level ecommerce metrics. Confirm that your events are implemented correctly before interpreting the funnel.
Inventory, fulfillment and payments
SKU — stock keeping unit
Your internal identifier for an item or variant. A blue medium shirt and a blue large shirt usually need different SKUs. Consistent identifiers help connect stock, orders, returns and reporting.
Example Your blue shirt in medium is SHIRT-BLU-M; blue in large is SHIRT-BLU-L. Separate SKUs let the warehouse pick the correct variant and keep each size’s stock accurate.
GTIN and barcode
A GTIN is a standardized product identifier; UPC and EAN are common GTIN formats. A barcode encodes an identifier for scanning. An internal SKU does not automatically replace a marketplace’s required product identifier.
Example A branded blender has a manufacturer-assigned GTIN. Your warehouse calls it BLENDER-BLK. The feed may need the GTIN while the team uses the internal SKU; inventing a barcode number is not a substitute for the required identifier.
Sell-through rate
Units sold ÷ units available to sell during the stated period × 100 under your chosen definition. Some reports use received units instead. Label the basis and returns treatment before comparing products or suppliers.
Example You begin with 120 units, receive 80 more and sell 100, with no returns. Using units available as the denominator, sell-through is 100 ÷ 200 = 50%. Record that basis beside the number.
Inventory turnover
COGS ÷ average inventory value over the same period, with both on a cost basis. It estimates how often inventory is sold and replaced. High turnover with constant stockouts can still mean lost sales.
Example Annual COGS is $60,000 and average inventory at cost is $15,000. Inventory turnover is 4× per year. Review stockouts and slow-moving products alongside the aggregate.
Days of stock cover
Available units ÷ expected daily unit demand. 300 units at 10 per day gives 30 days. Holiday demand, reservations and incoming stock can make a simple trailing average misleading.
Example You have 300 units available and expect to sell 10 daily. Stock cover is 30 days. At holiday demand of 15 daily, the same stock covers only 20 days.
Lead time, safety stock and reorder point
Lead time is the wait for replenishment; safety stock is a buffer. A basic reorder point is expected demand during lead time + safety stock. Adjust for demand variability, supplier reliability and cash constraints.
Example A product sells 10 units daily, takes 14 days to replenish and has a 40-unit safety buffer. Reorder point is 10 × 14 + 40 = 180 units, assuming stable demand and lead time.
MOQ — minimum order quantity
The minimum quantity a supplier accepts for an order. A lower unit cost from a larger order can still be a poor decision if stock sits unsold or ties up cash you need elsewhere.
Example A supplier offers a $9 unit price at a 500-unit minimum instead of $10 at 100 units. The larger order requires $4,500 rather than $1,000 upfront. Compare sell-through and cash needs before choosing the cheaper unit.
Fulfillment and 3PL
Fulfillment covers preparing and shipping an order. A 3PL is a third-party logistics provider handling agreed operations. Compare receiving, storage, pick/pack, packaging, shipping, returns, minimums and peak-season fees—not just the headline pick fee.
Example A 3PL quotes $3 pick/pack, $1 packaging and $7 postage per order. That is $11 before allocated receiving, storage, returns and other fees. Ask for the full bill at your expected volume.
Return rate and RMA
Return rate needs a denominator: returned orders, units or revenue each tell a different story. Compare matured cohorts. RMA means return merchandise authorization, a process or reference for approving and tracking a return.
Example A matured cohort has 200 orders, and 10 orders include a return. Its order-based return rate is 5%. A unit-based or revenue-based return rate could be different.
Payment gateway, processor and payout
A gateway passes payment information; a processor helps handle the transaction. Providers may bundle these roles. A payout is the transfer to your bank after applicable fees, timing rules or reserves; it is not the same as sales revenue.
Example A $100 payment with an illustrative $3 processing fee yields $97 before other deductions. The bank payout may arrive later or be grouped with other payments; reconcile the payout report instead of calling every deposit revenue.
Chargeback
A payment dispute that may reverse funds and create additional fees. It is different from a normal merchant-issued refund. Track reasons, evidence deadlines and customer-service patterns that could prevent repeat disputes.
Example A customer disputes a $120 card payment. The provider requests delivery evidence by a deadline and may debit the disputed amount plus fees. A voluntary $120 refund follows a different workflow.
BNPL — buy now, pay later
A payment option that divides a purchase into installments under a provider’s terms. Check merchant fees, eligibility, payout and refund handling. Clear total prices and terms matter, especially for considered purchases.
Example An eligible buyer sees a $200 purchase split into four $50 payments under the provider’s terms. The merchant must still account for its actual fees and refund process; the order is not worth more because payment is split.
Do not wait until the shelf is empty.
Start with 300 available units. Expected demand is 10 per day, replenishment takes 14 days, and the safety buffer is 40 units.
- Day 0: 300 units30 days of cover at 10 units per day.
- Day 12: 180 unitsReorder now: 140 units of lead-time demand + 40 safety units.
- Day 26: 40 unitsExpected replenishment arrival; four days of buffer remain before stockout if it is delayed.
Reorder point = 10 × 14 + 40 = 180 units. This simplified plan assumes steady demand, fixed lead time and no other inbound or committed inventory. Real replenishment should account for inventory position and variability.
Apps, integrations and store technology
App, plugin and extension
Software that adds a capability to your platform. The labels vary by ecosystem. A review widget, subscription service or inventory connector can extend a store, but each adds cost, dependencies and maintenance.
Example A gift-message extension adds a field at purchase and includes the message on the packing slip. Test both steps: a visible field is not useful if fulfillment never receives the message.
Theme versus app
A theme controls much of the storefront’s presentation. An app adds functionality or services. First check your theme settings and built-in platform features; a layout change may not require another subscription.
Example You want a collapsible materials-and-care section. If your theme already supports that block, configure it before paying for an app that adds the same visual feature.
Integration
A connection that moves data or actions between systems. Ask what syncs, in which direction, how often, and what happens on failure. “Integrates with” does not guarantee every field or workflow you need.
Example An order integration sends a paid order to the warehouse and returns tracking to the store. Verify SKU mapping, partial shipments and error alerts; a connection that only syncs products would not satisfy this job.
API — application programming interface
An agreed way for software to request data or actions from another system. Access permissions, usage limits and supported operations determine what a connector or custom agent can actually do.
Example An inventory tool asks the store API for current stock and submits an approved update. The API’s permitted operations and access scope determine whether that update is possible.
Webhook
A notification one system sends when something happens, such as an order being paid. A robust integration handles retries and duplicate notifications without creating duplicate shipments or messages.
Example The store sends an “order paid” notification for order 1042. If it retries the same notification after a timeout, the shipping integration should recognize the duplicate and avoid creating a second shipment.
Automation versus AI agent
An automation follows a configured trigger and actions. An AI agent can interpret a task and choose steps within its tools and permissions. Keep approval points for spend, customer messages and consequential store changes.
Example A fixed rule tags orders above $300 for review. An AI agent can summarize why an order needs attention and draft a response. A person still approves any refund or customer message in this workflow.
Permissions and scopes
The data and actions an app is allowed to access. Read them before installation. A feature needing product data does not automatically justify access to everything in the customer record.
Example A delivery-date app asks to read orders so it can attach fulfillment instructions. Review whether it also requests customer or write access, and require a clear reason for each permission.
TCO — total cost of ownership
The full cost of running a tool: subscription, usage, transactions, setup, support, staff time and eventual migration. Compare realistic order volume and message volume, not only an entry-level price.
Example An app costs $49 monthly, $20 in expected usage and two staff hours valued at $30 each. Modeled monthly TCO is $129, plus setup and any other fees. Staff time is an economic cost even when it is not an extra invoice.
Staging and rollback
Staging is a separate test environment; rollback is a planned way to restore working behavior. A duplicate theme helps test visual changes but does not isolate every app’s billing, inventory, customer data or backend effects.
Example Test a new product-options widget on a duplicate theme, but verify whether the app also changes live products or billing. Save the prior settings and document the removal steps before turning it on.
Headless commerce
A storefront built separately from the commerce backend and connected through APIs. It can offer flexibility while increasing integration and maintenance work. It is an architectural choice, not a necessary step for a successful store.
Example A custom storefront displays products using a commerce backend’s APIs. Your team now owns that storefront’s search, cart and integration behavior rather than relying entirely on a platform theme.
How a paid order becomes a shipment
One practical example of an event, an integration and an API working together.
- 1Store event
Order 1042 is paid. The store sends an “order paid” webhook notification.
- 2Integration check
The connector validates the notification, checks stock mapping and recognizes any duplicate event.
- 3API action
The connector requests one shipment through the shipping service’s API and records the response.
If the same webhook is retried, the integration checks its event and order records so it does not create a second shipment. Permissions govern what it can do; failure alerts tell a person when to intervene.
Turn the glossary into a weekly decision
Define your scorecard
Write down each metric’s formula, reporting source, time zone and owner. Start with sessions, orders, net sales, AOV, contribution and acquisition spend. Use the free daily scorecard for the arithmetic.
Explain one change
Traffic up but orders flat? Inspect traffic quality and checkout. AOV up but contribution down? Inspect discounts, shipping and product mix. CAC up? Check new-customer counts and cost allocation before changing the budget.
Choose one improvement
Assign an owner, a deadline and one success measure. If the problem needs a new capability, use the app marketplace guide to search by the job you need done.
Review the result
Record what changed, what it cost and what happened to the customer experience. Keep the improvement, fix it or reverse it. Reconcile refunds and longer-term customer value after the relevant window matures.
A few questions worth asking in every meeting
- “Is that revenue, contribution or profit?”
- “Does that denominator mean orders, customers, users or sessions?”
- “Are returns included, and have they had time to arrive?”
- “Is that observed performance or a forecast?”
- “Did we cause those sales, or are we only being credited for them?”
- “What decision will change because we know this?”
For a short seasonal version, use Holiday metrics that matter. For the practical next step, read How to find apps that extend your ecommerce store.
Reviewed November 2, 2026. Dollar amounts are illustrative USD examples. Platform labels and reporting definitions can change; verify the definition in the report you use.
Ecommerce Growth Coaching · $750 / month
Two working sessions per month on one growth priority, with written next steps and one agreed artifact review.
Start with a free fit conversation. A written scope and payment instructions come before paid work begins.